Card stats
Updated · ~18,431 games · bots never counted · Out of date: the daily refresh is overdue
Every card
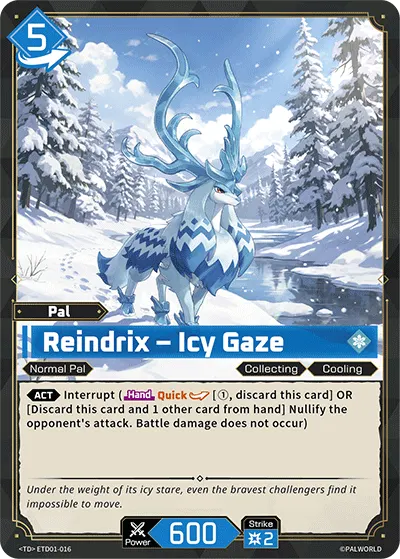
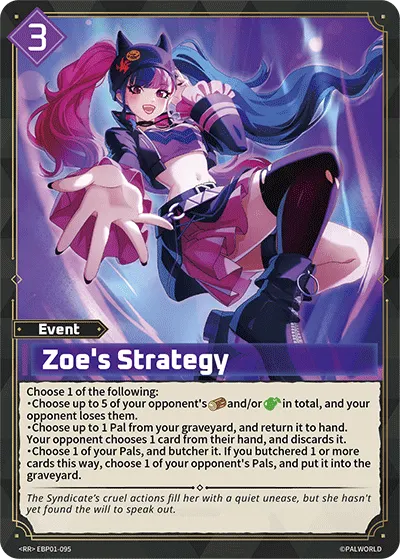
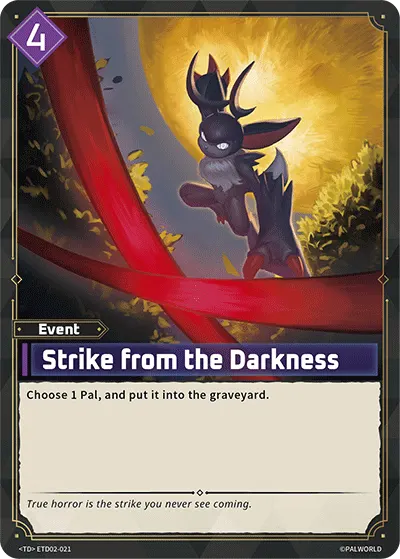
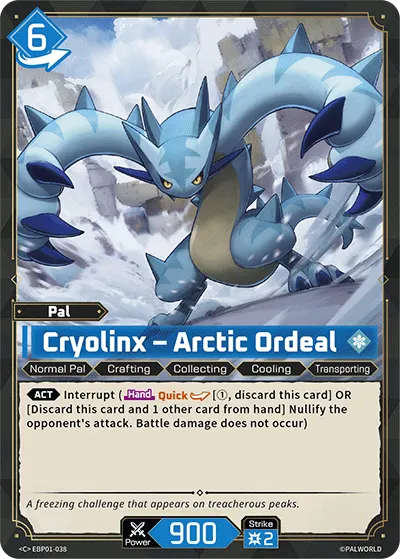
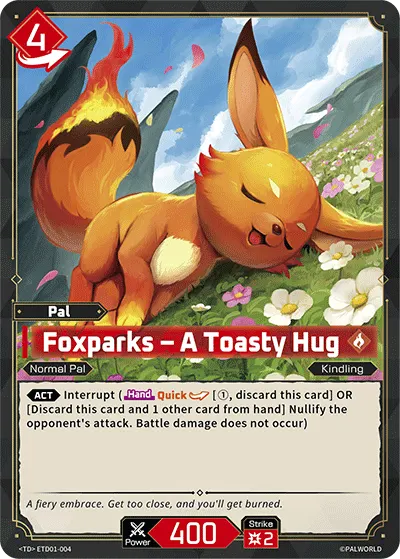
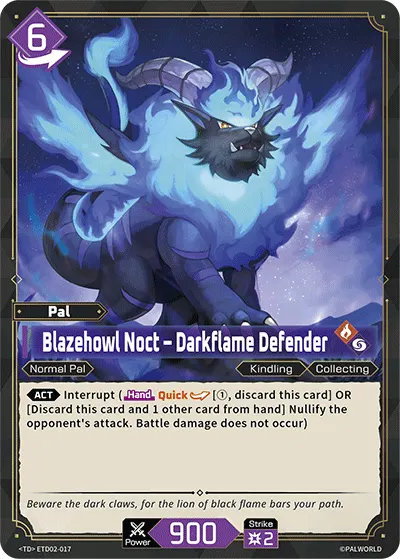
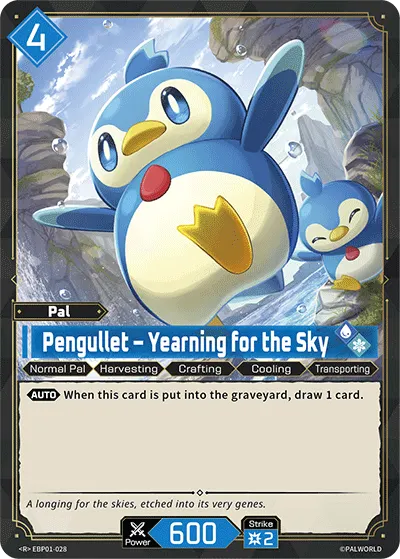
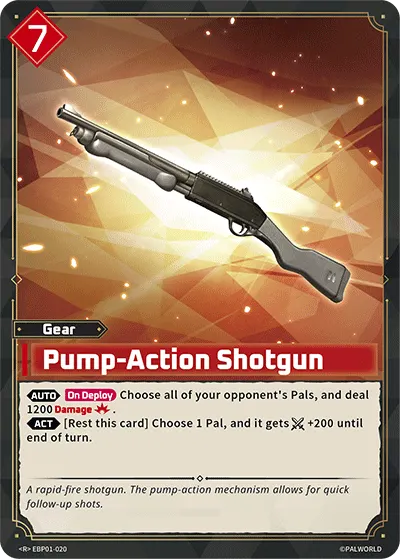
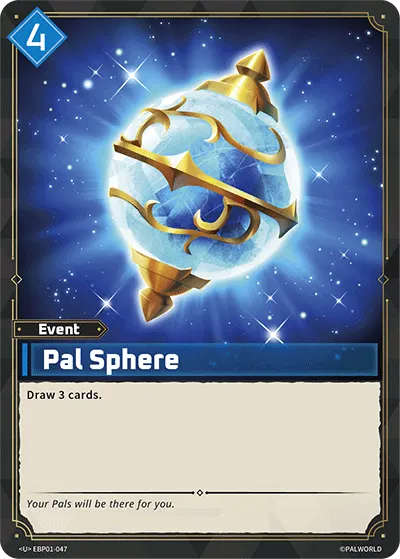
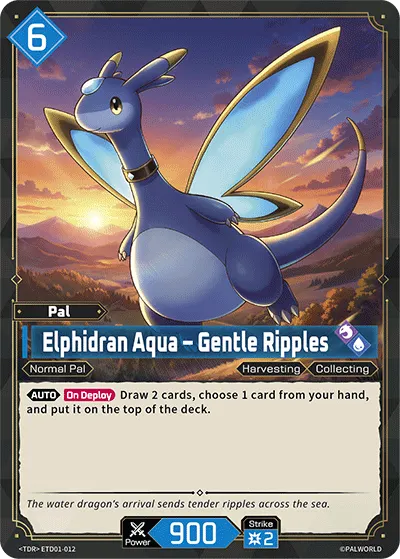
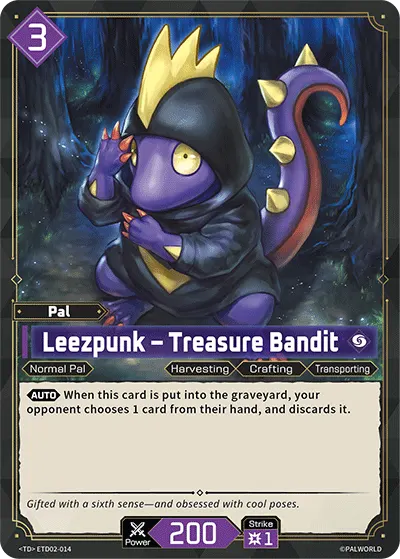
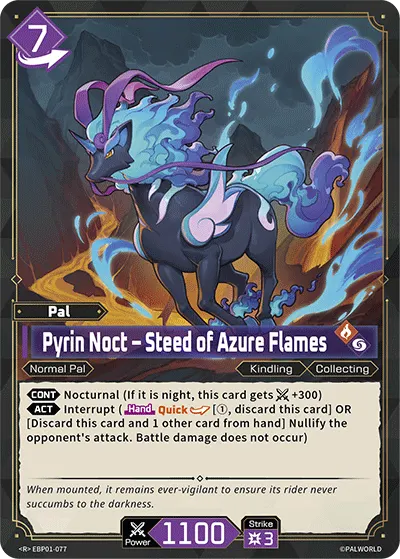
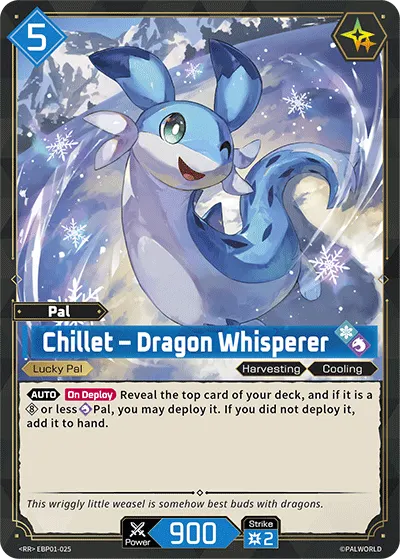
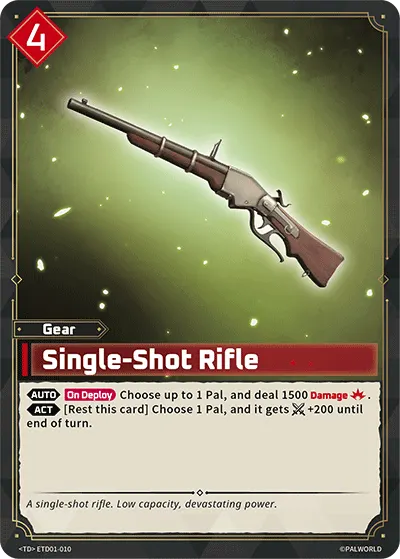
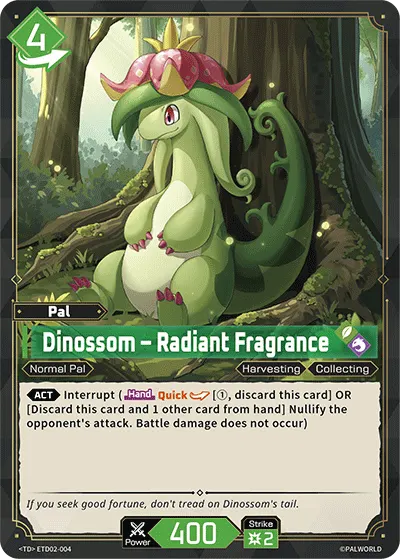
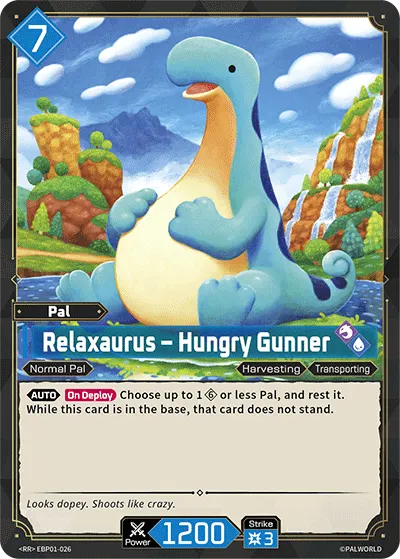
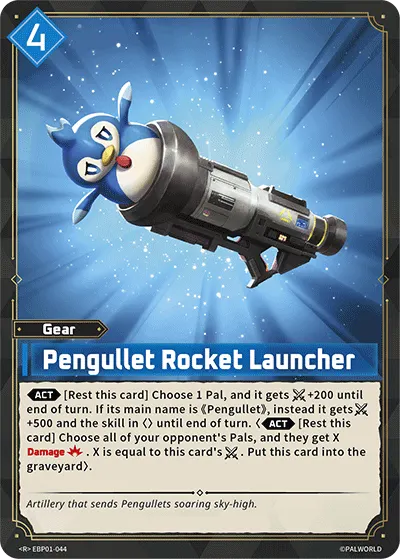
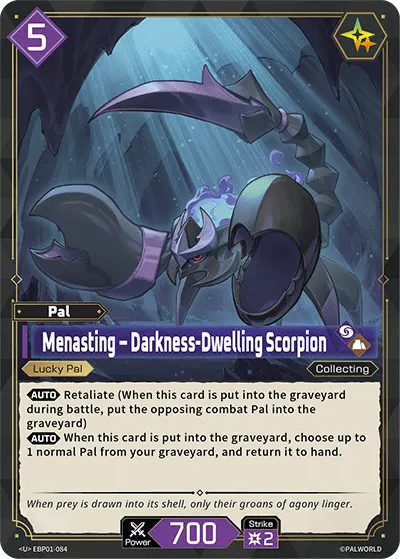
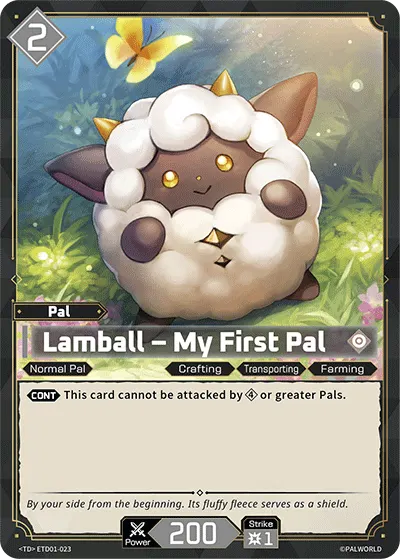
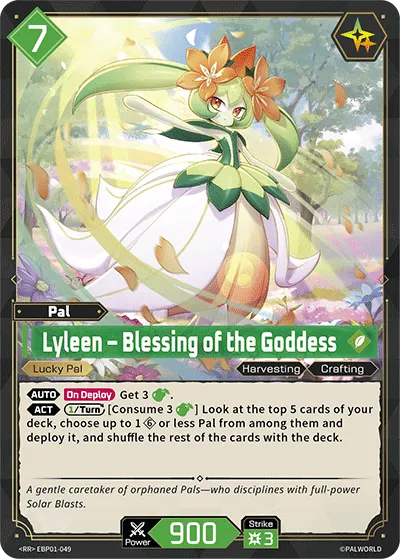
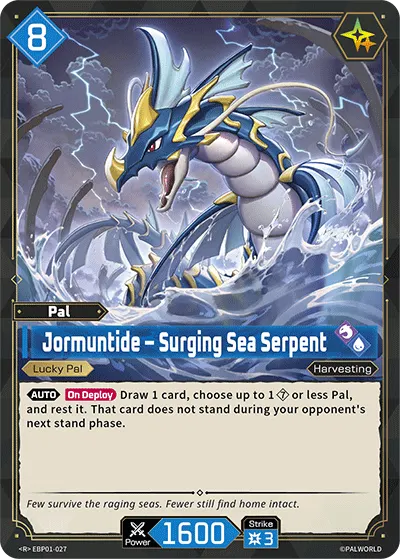
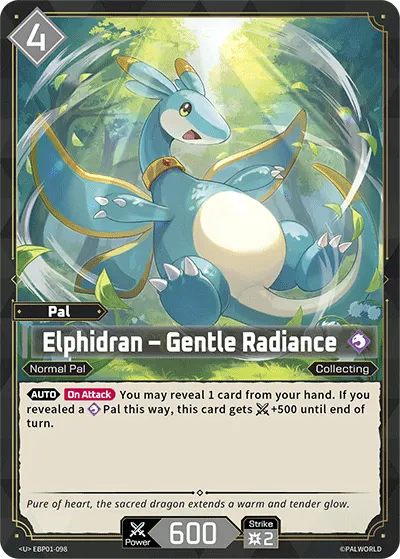
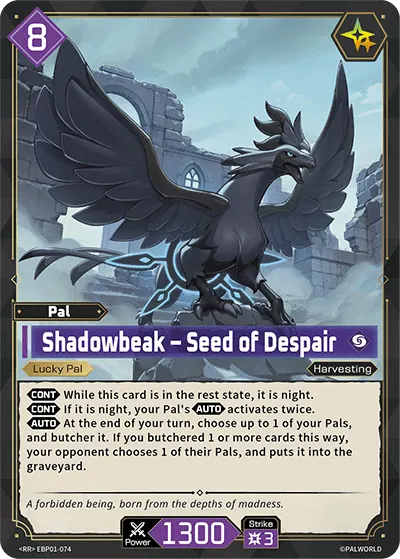
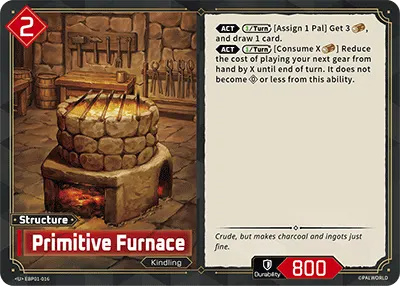
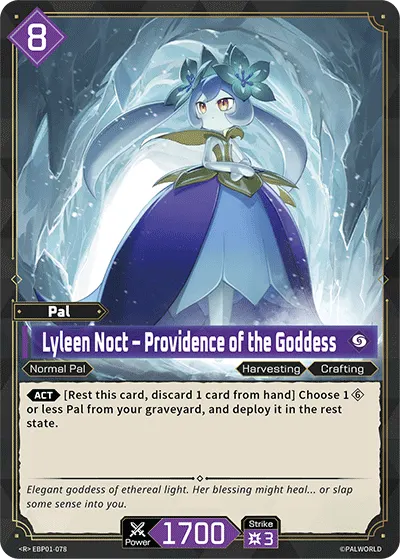
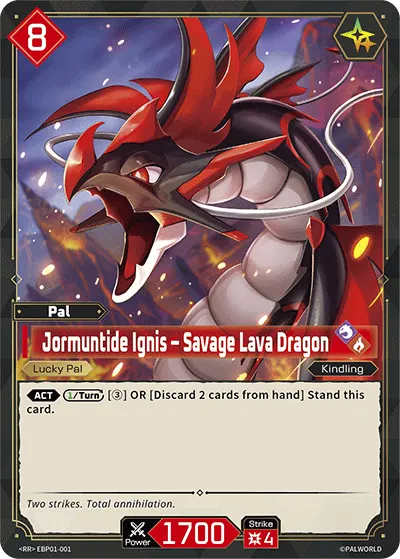
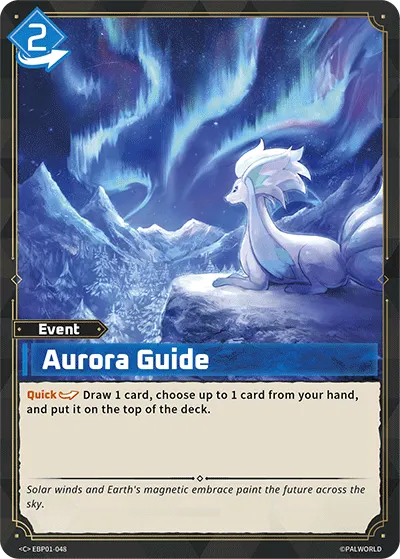
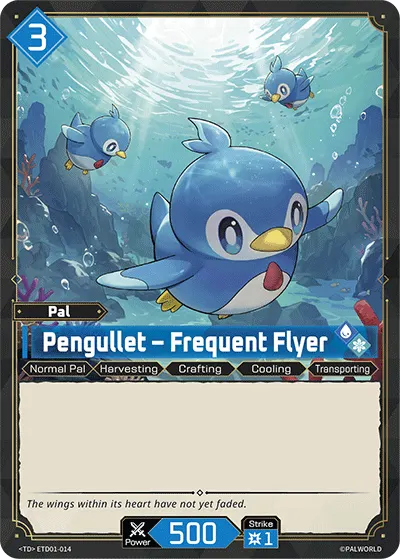
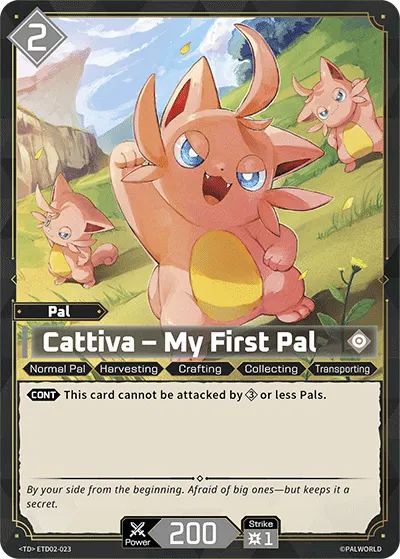
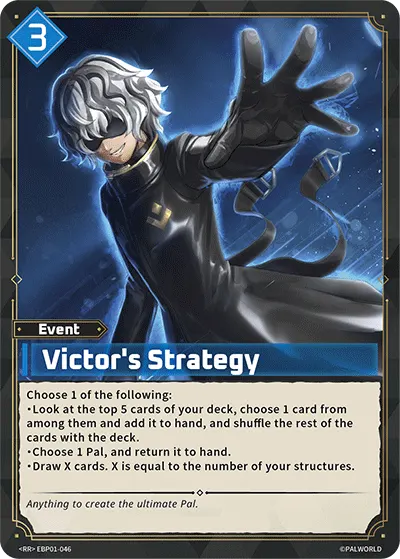
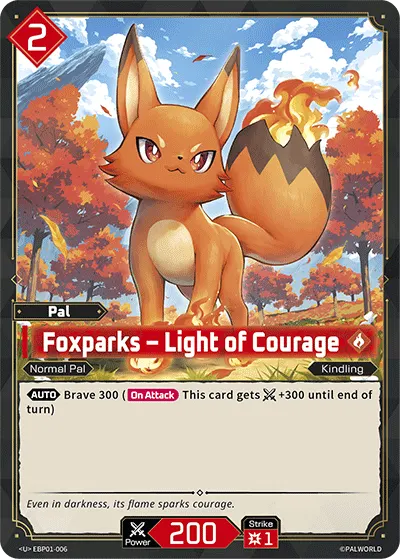
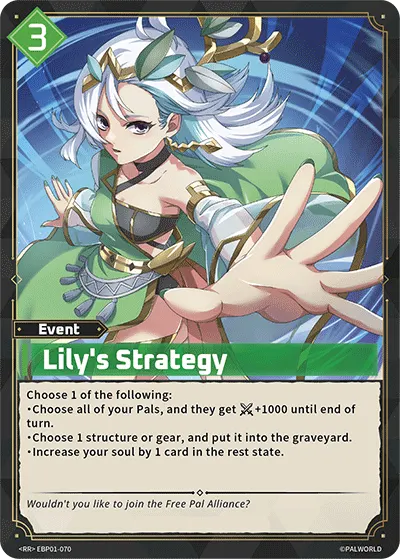
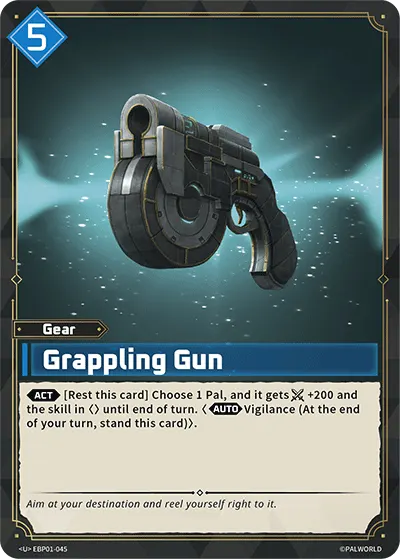
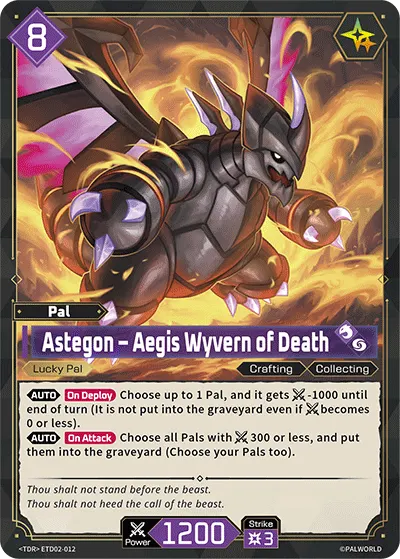
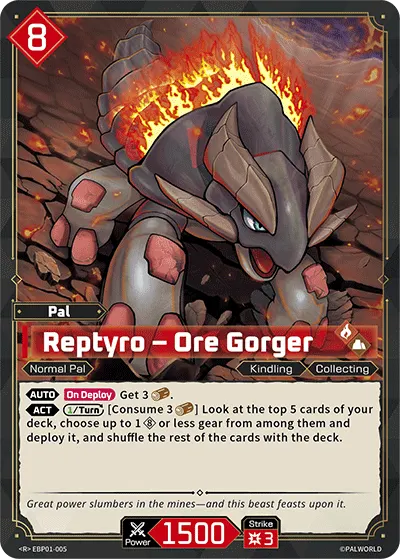
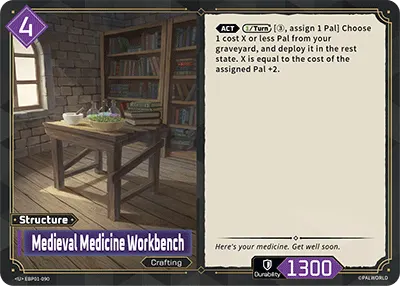
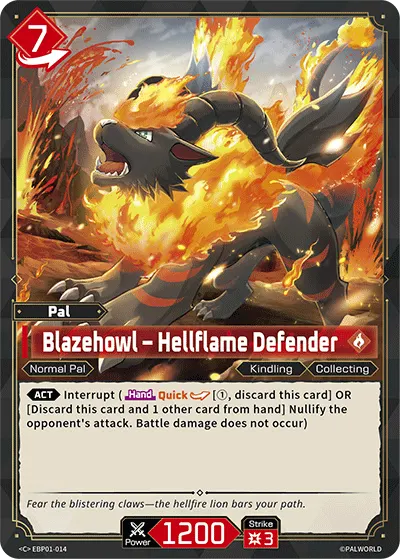
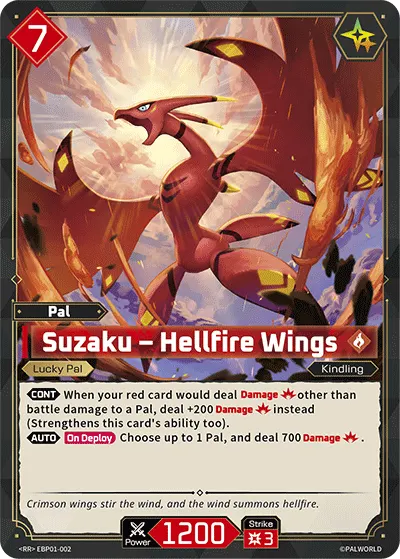
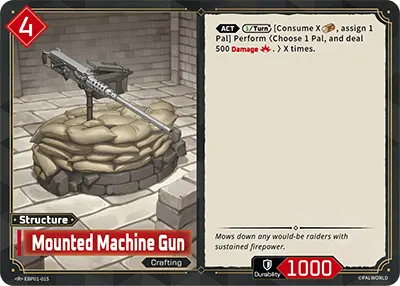
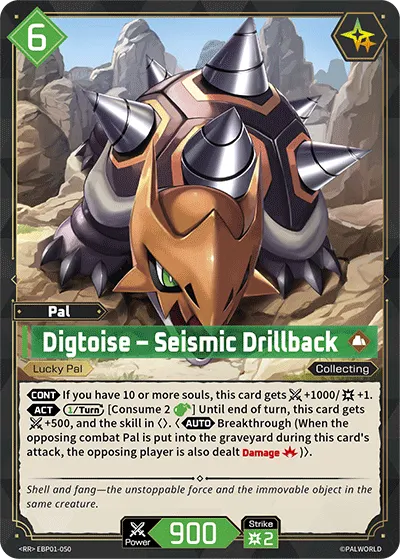
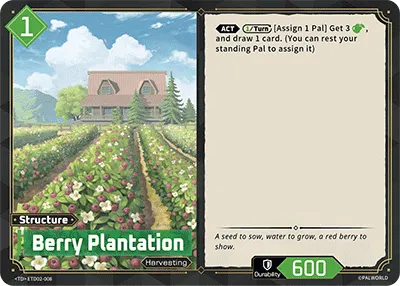
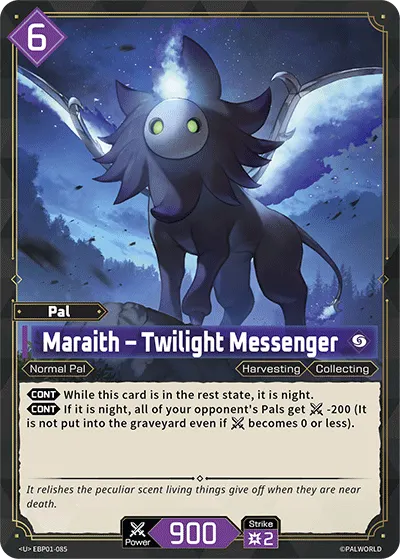
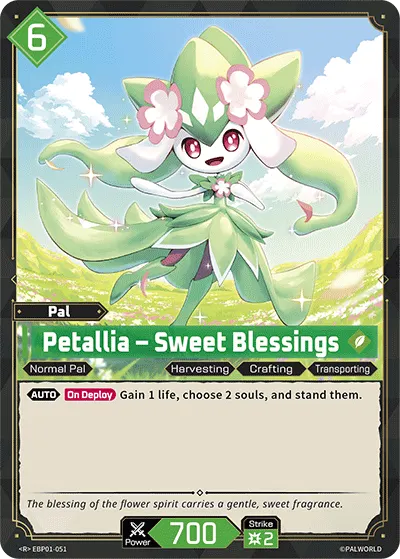
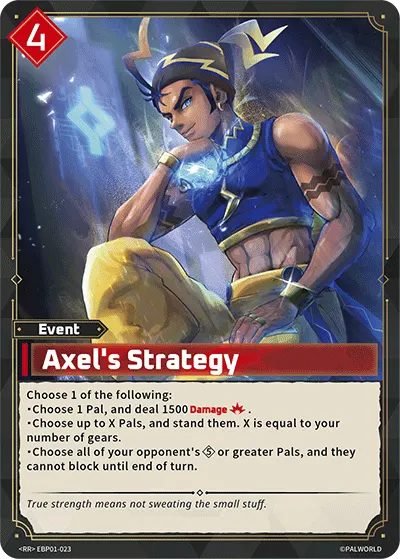
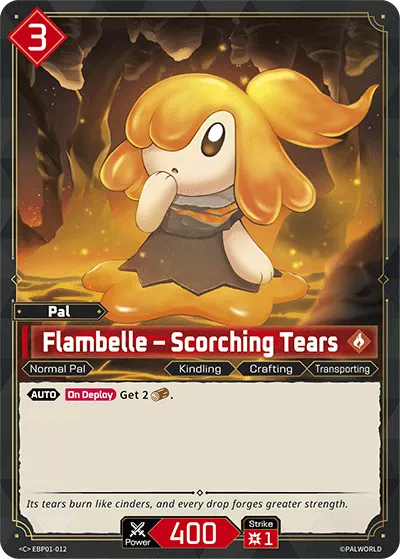
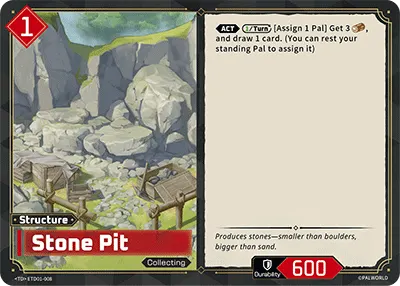
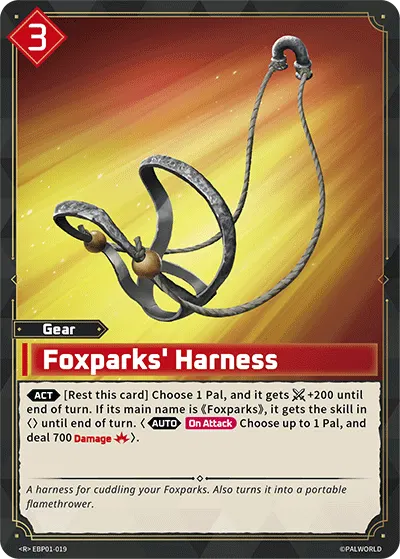
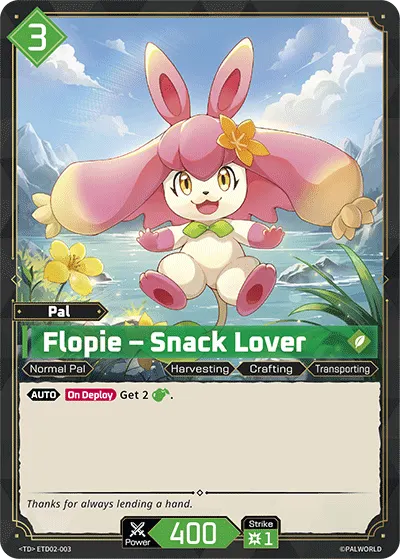
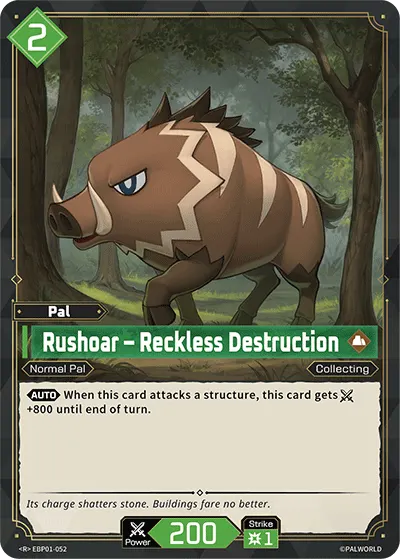
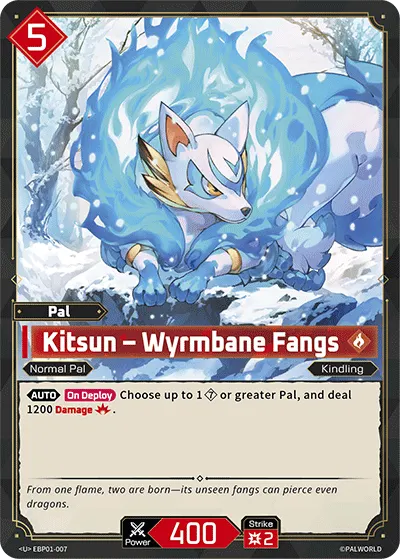
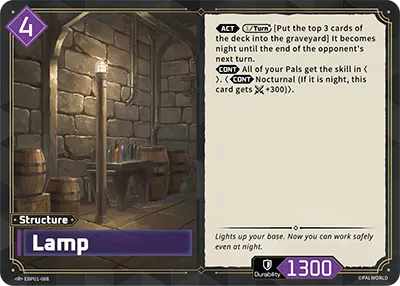
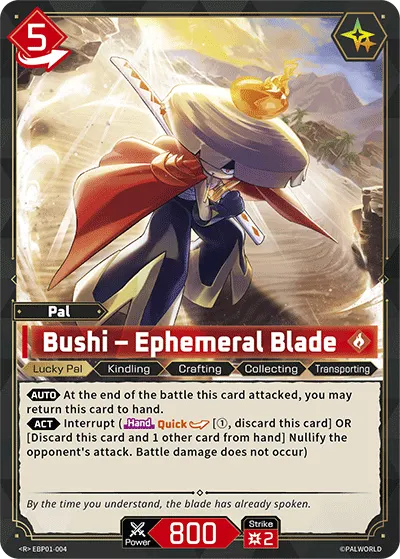
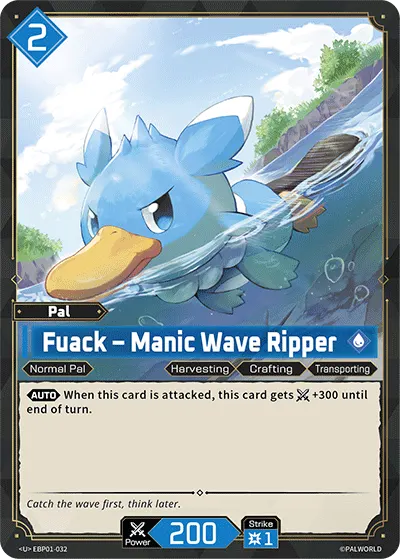
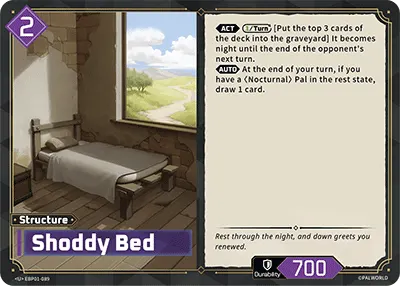
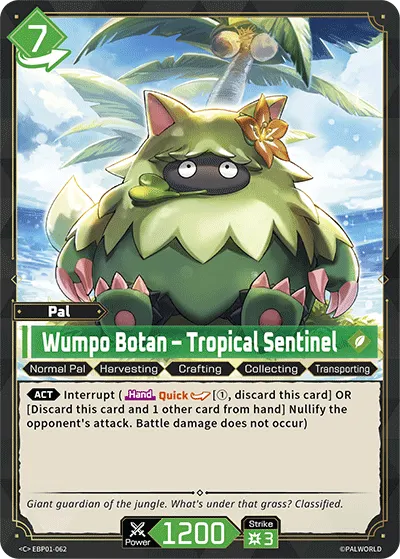
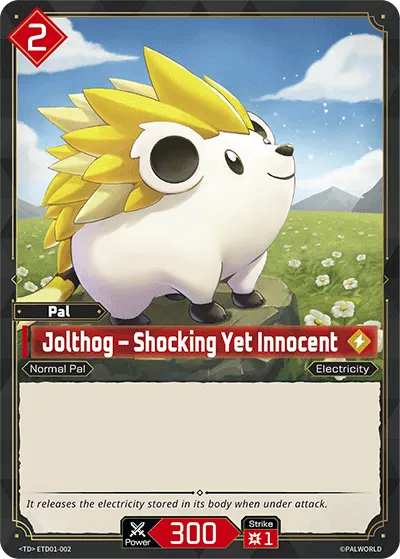
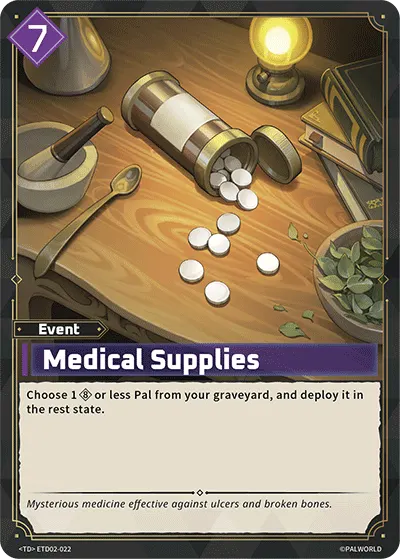
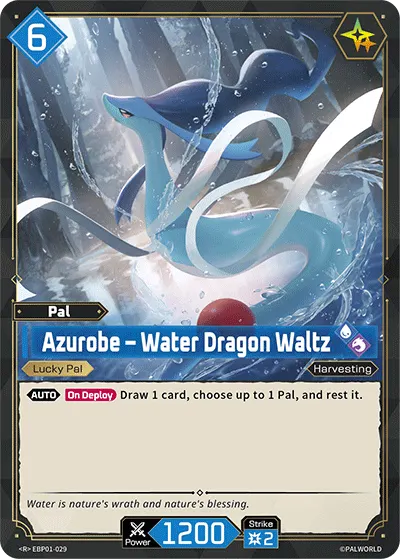
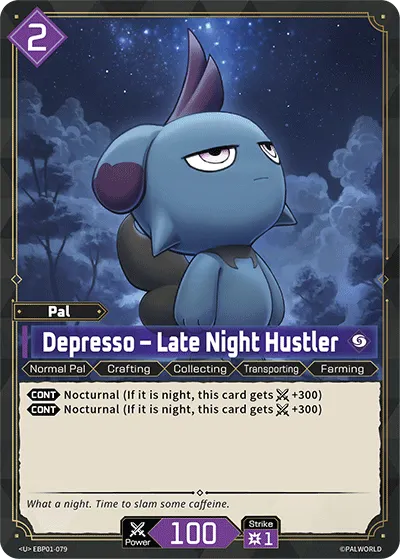
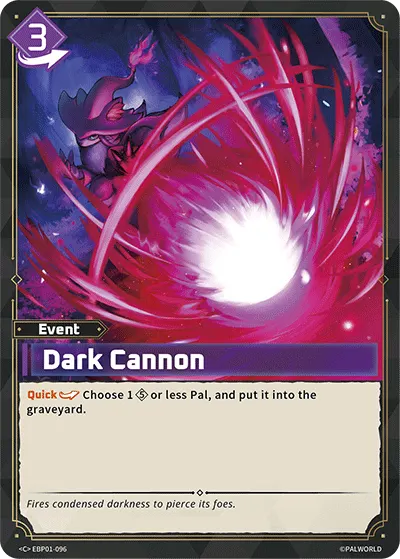
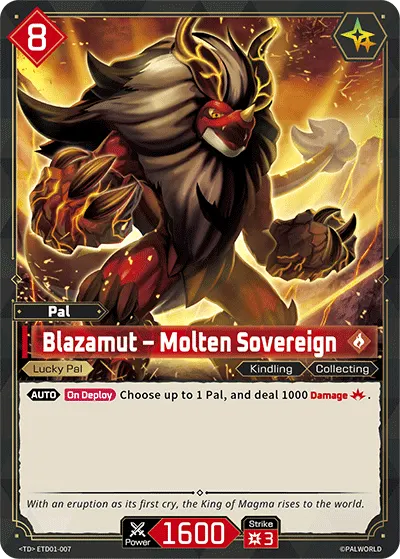
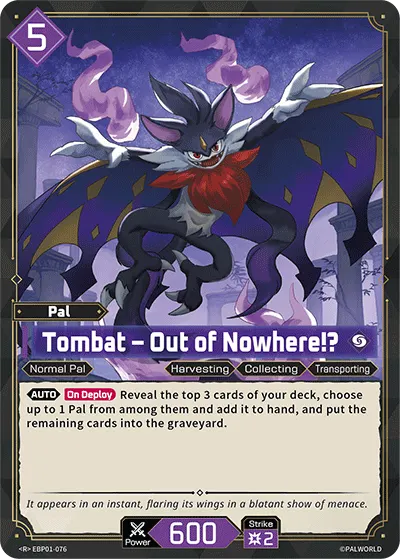
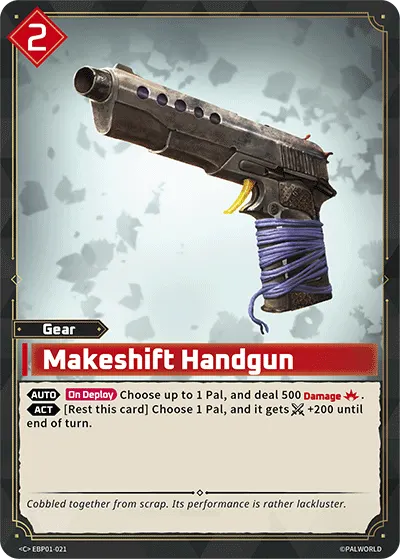
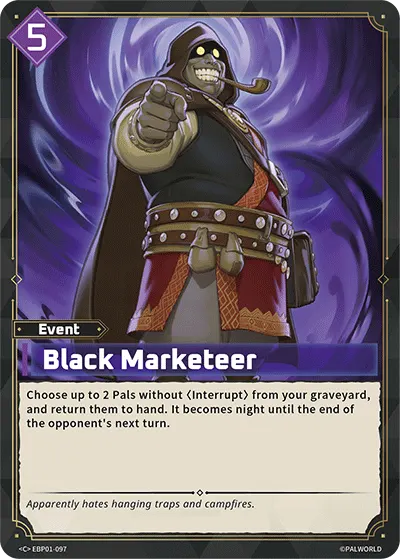
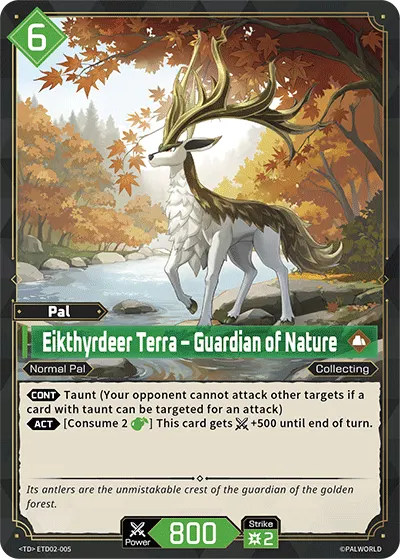
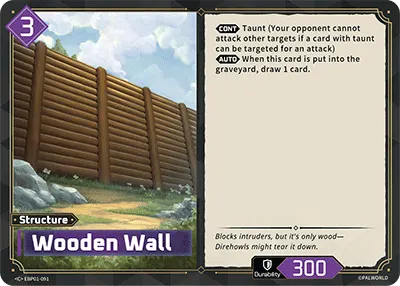
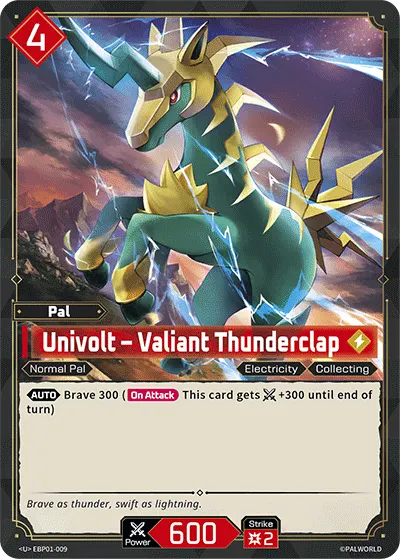
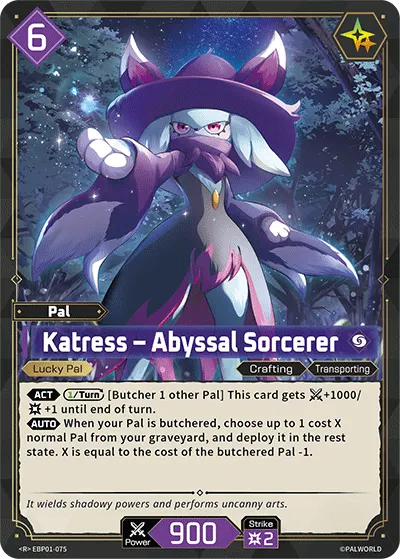
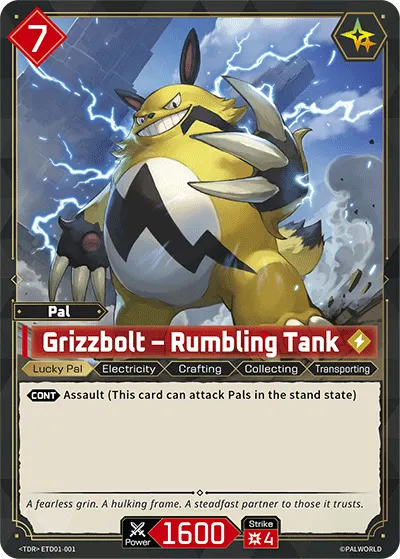
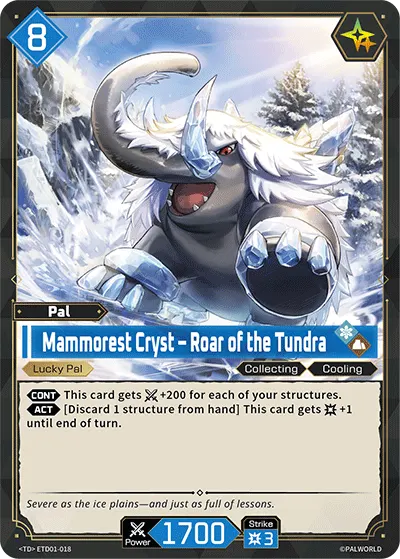
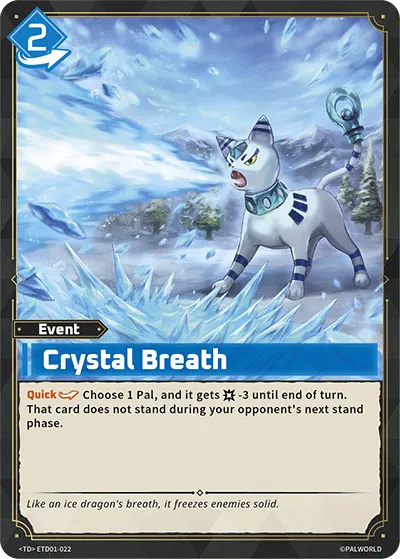
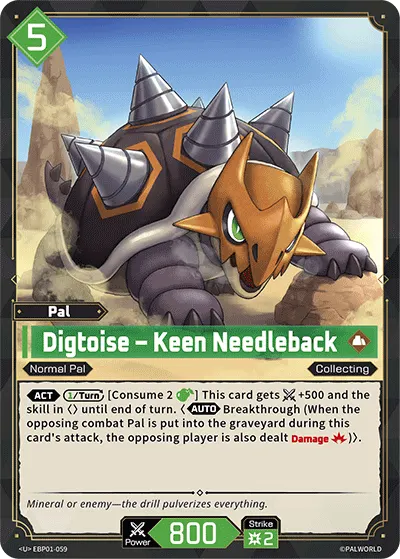
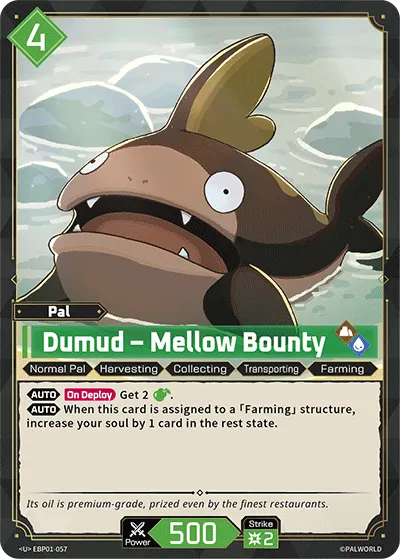
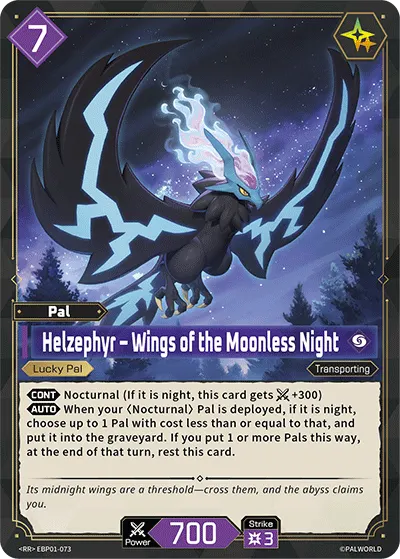
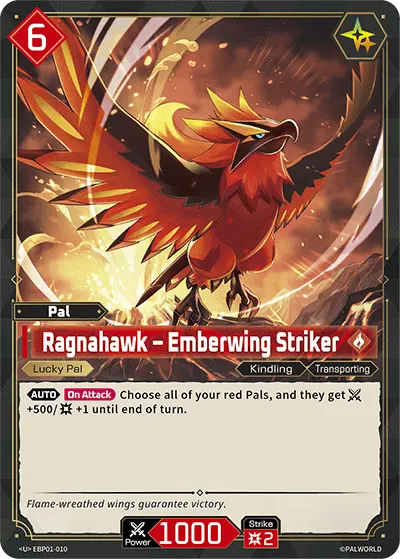
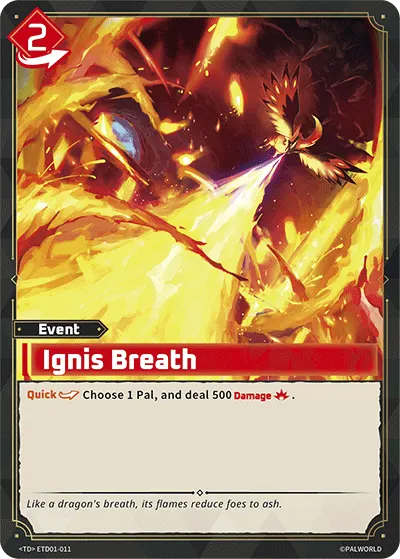
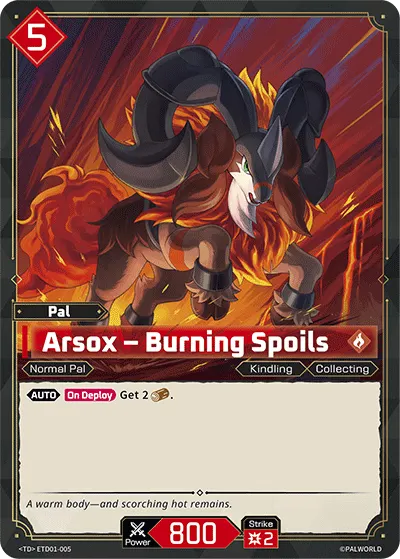
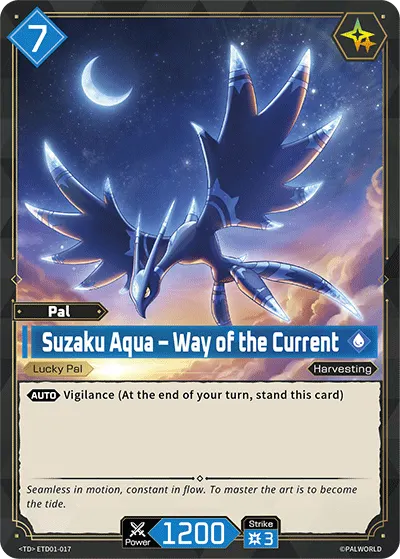
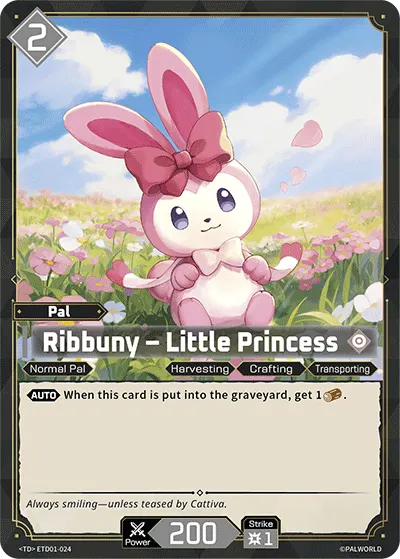
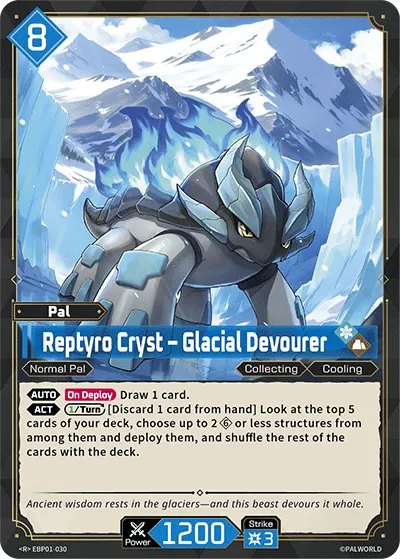
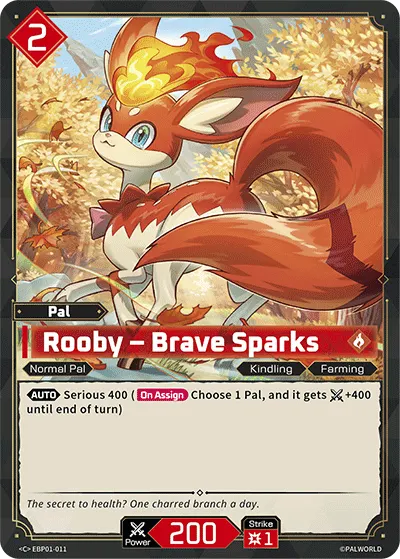
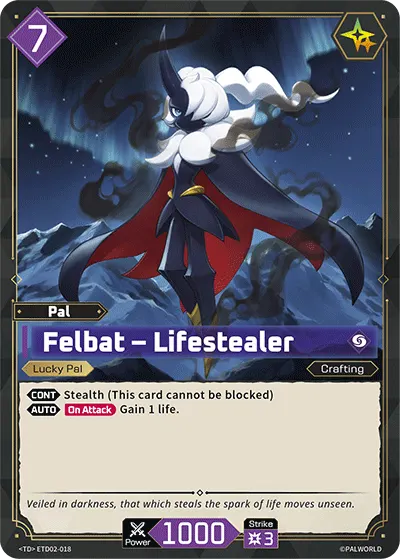
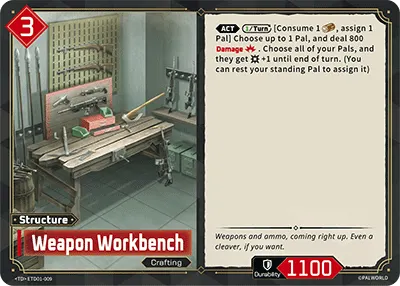
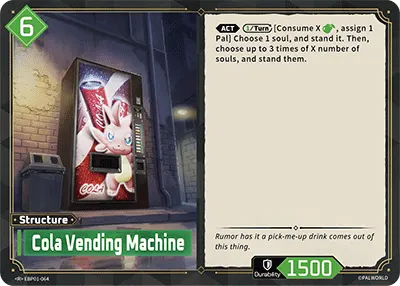
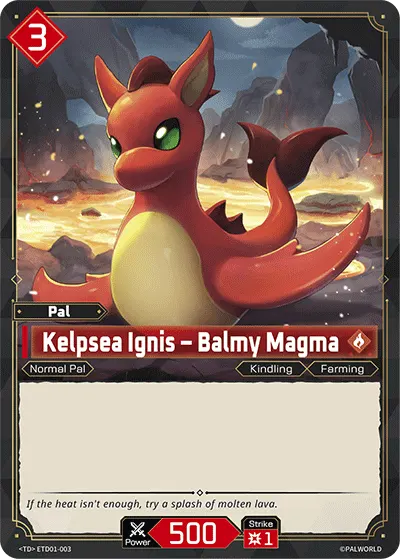
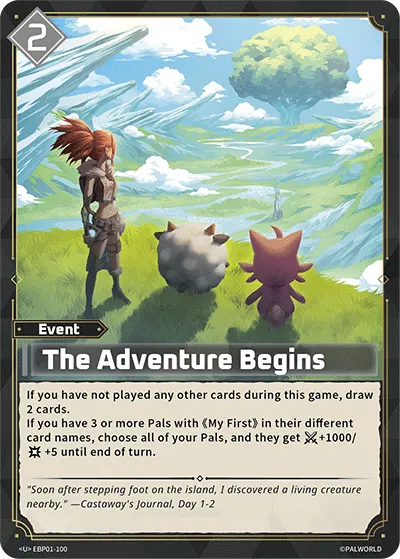
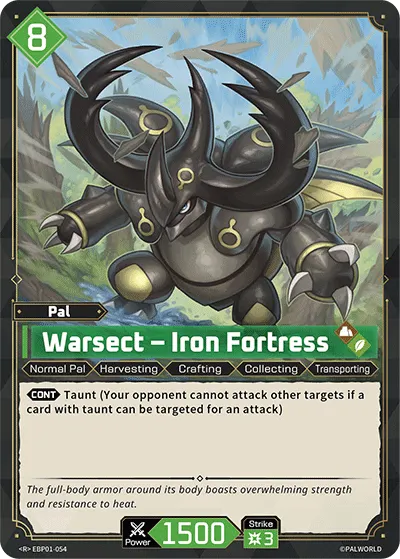
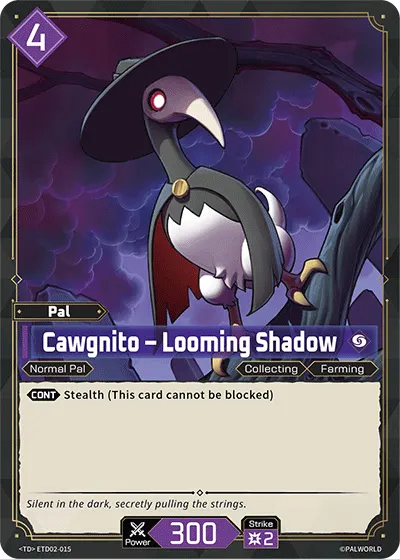
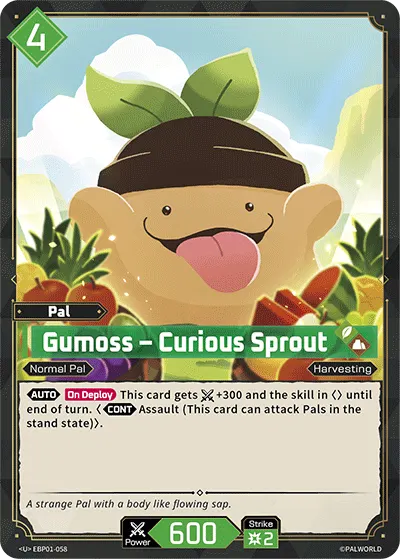
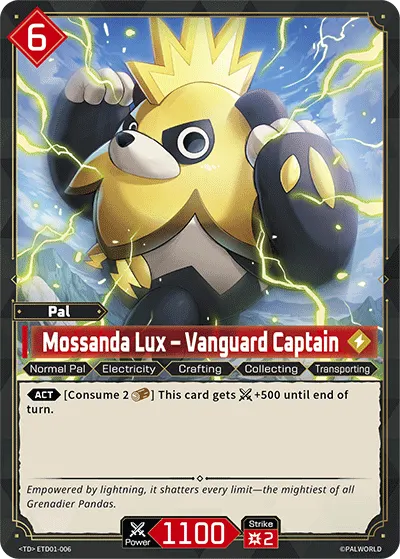
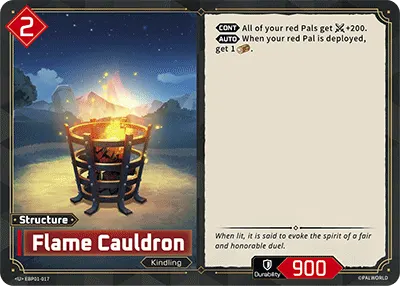
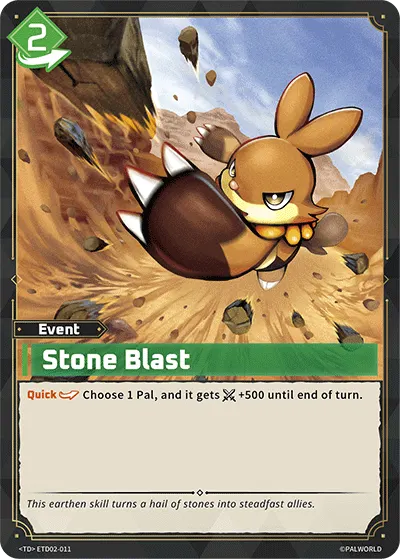
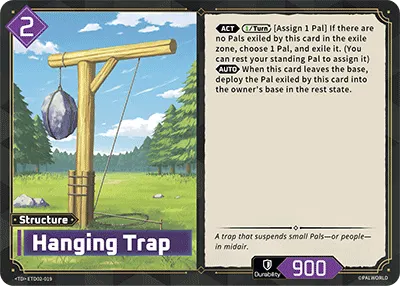
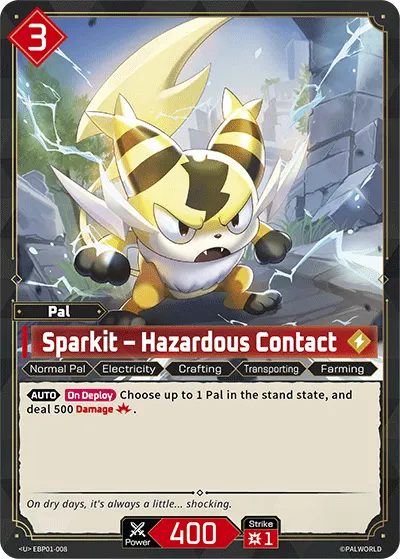
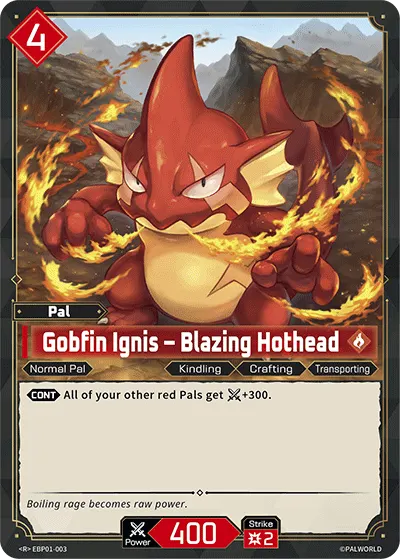
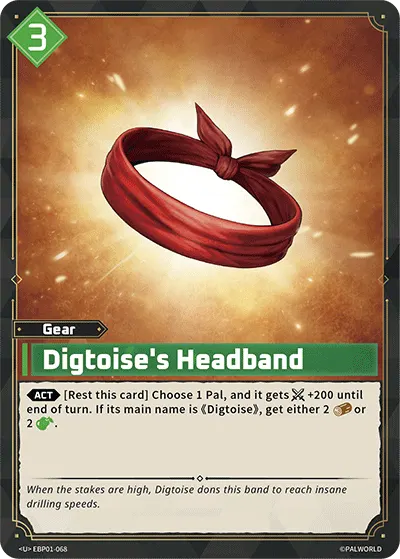
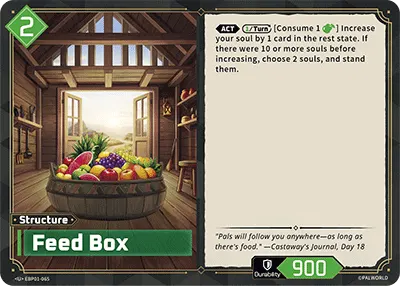
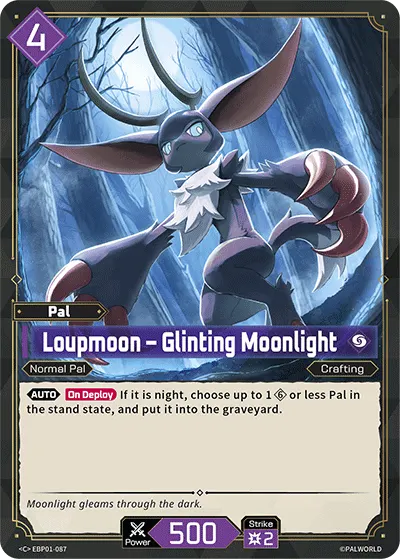
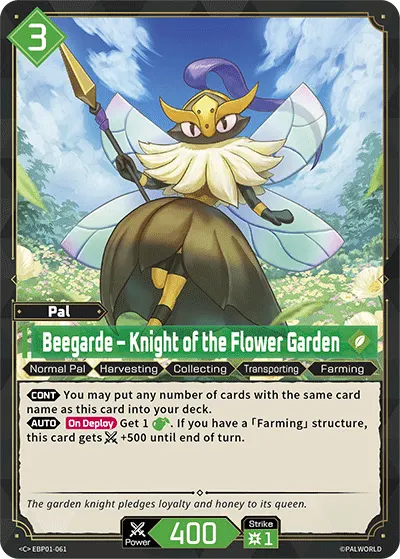
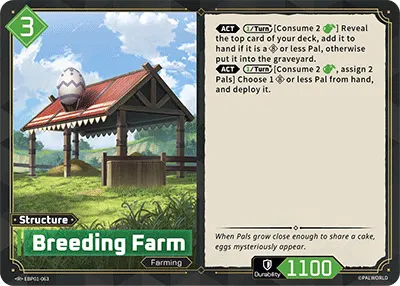
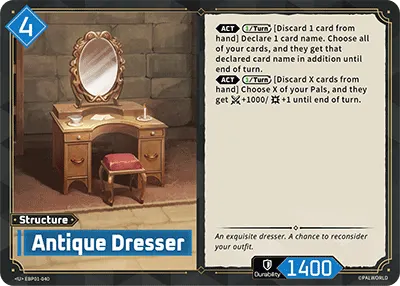
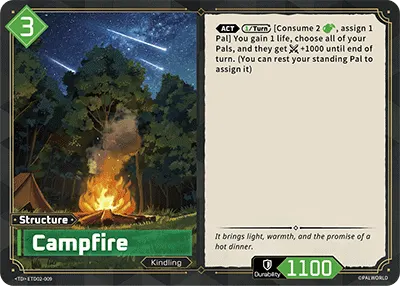
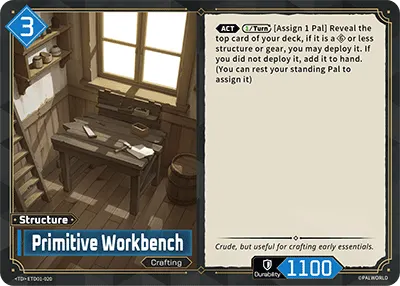
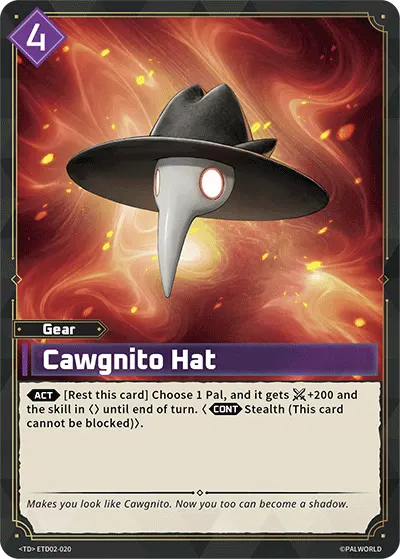
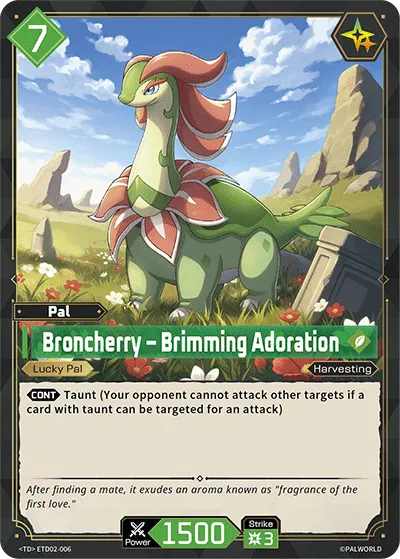
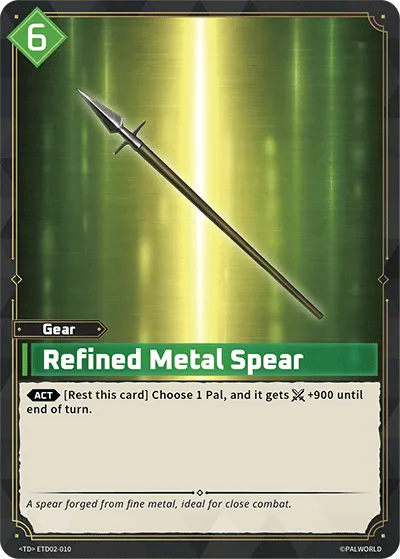
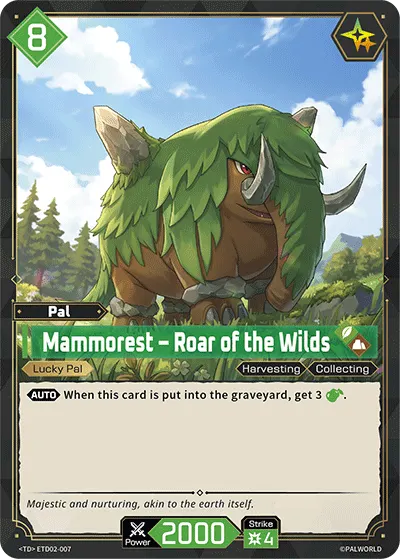
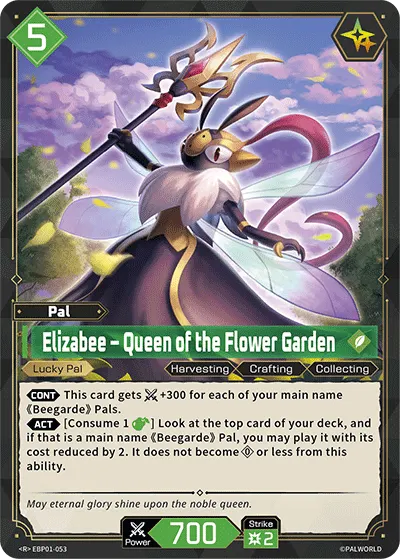
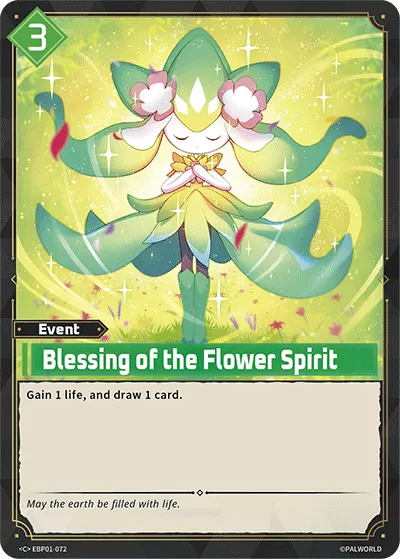
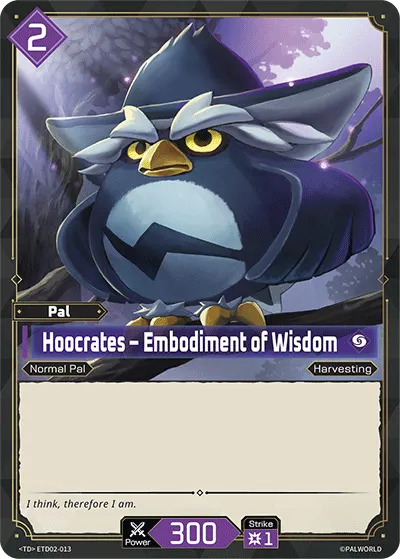
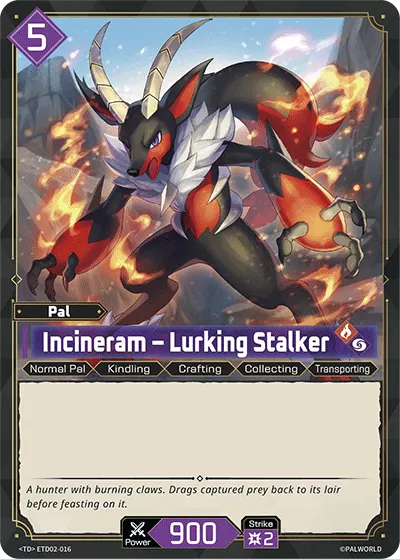
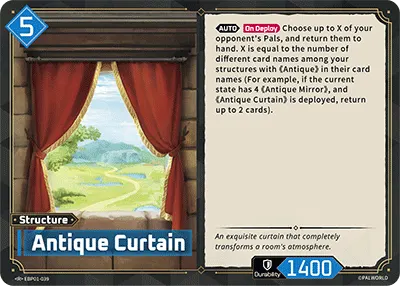
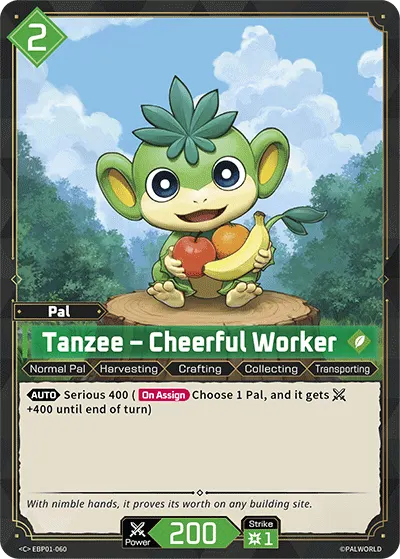
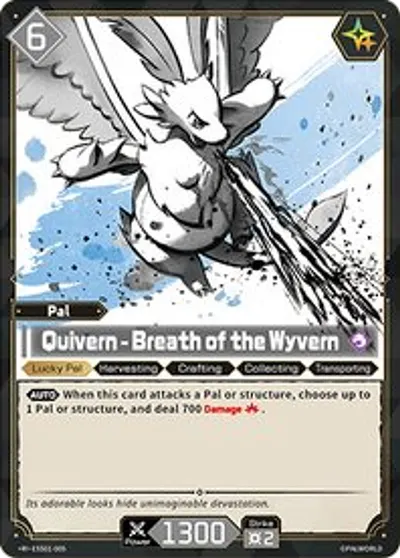
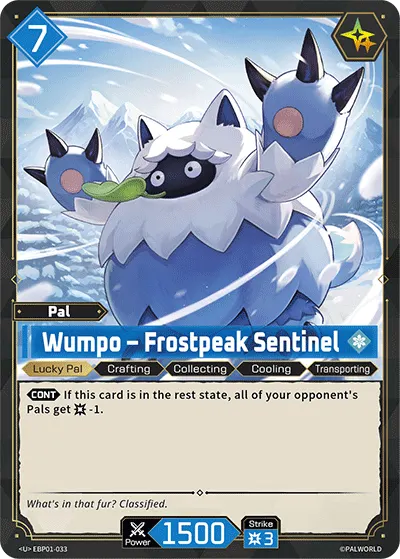
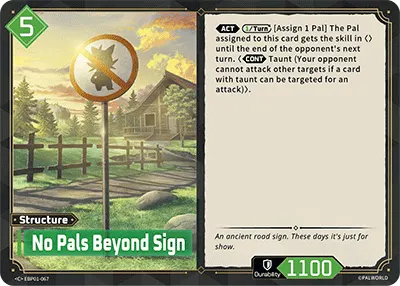
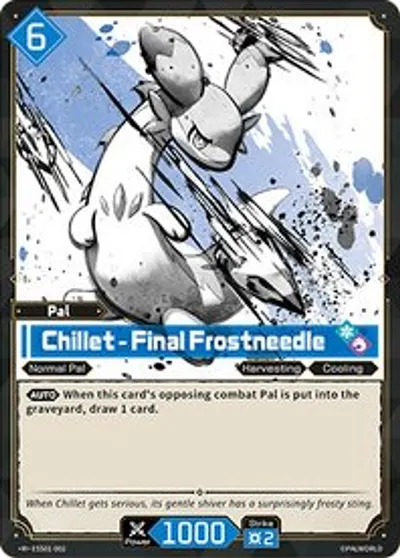
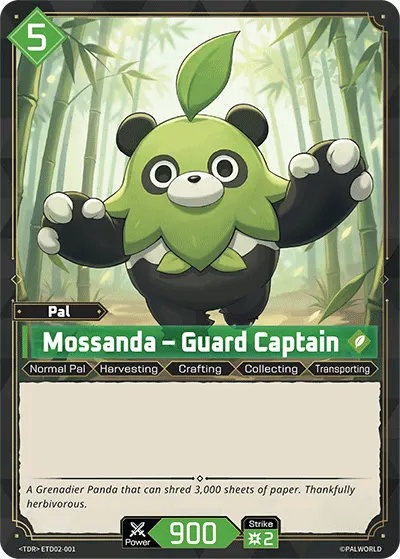
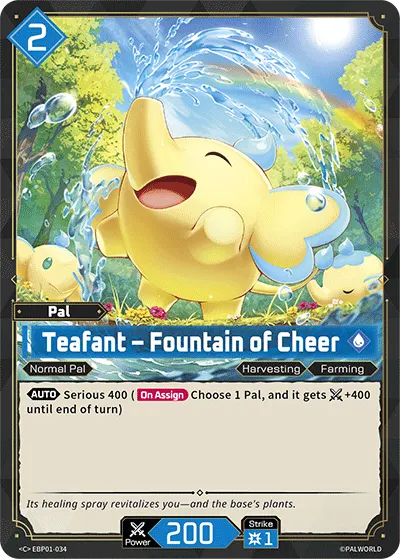
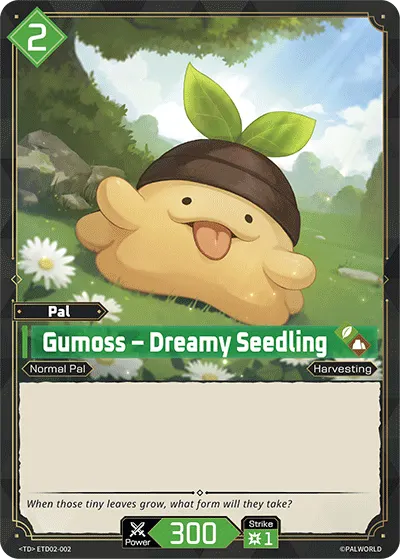
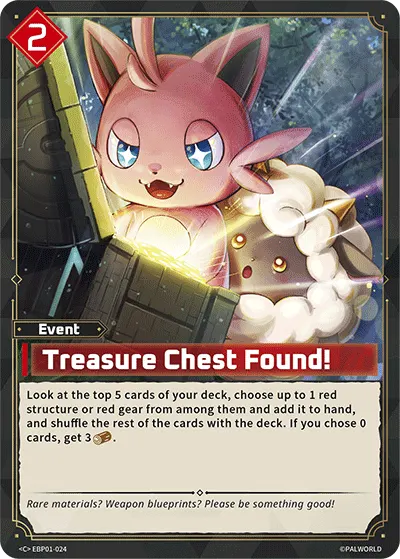
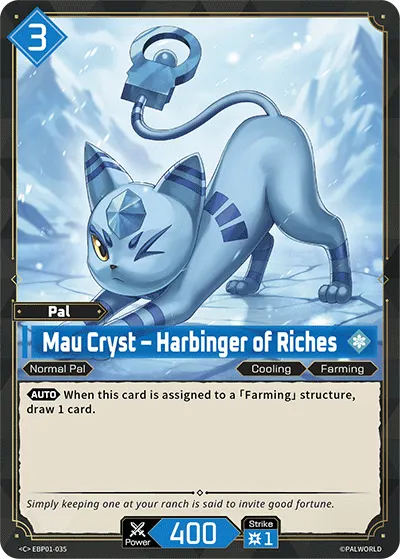
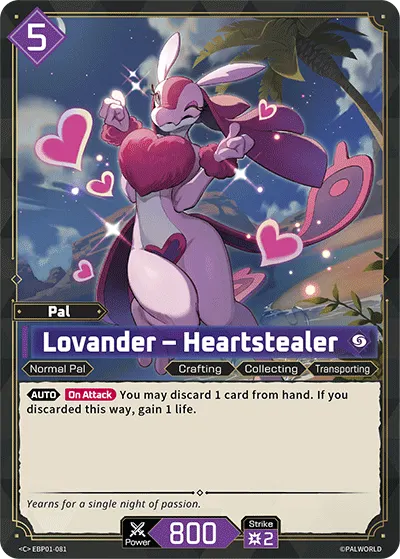
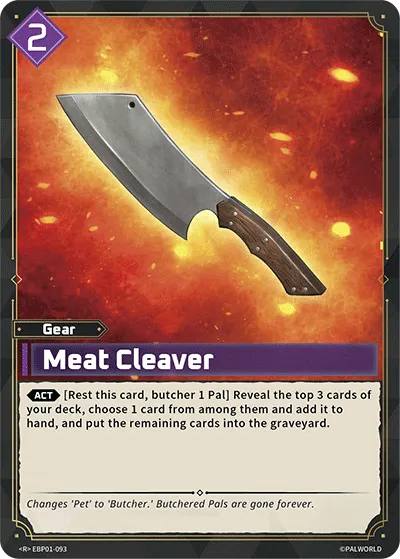
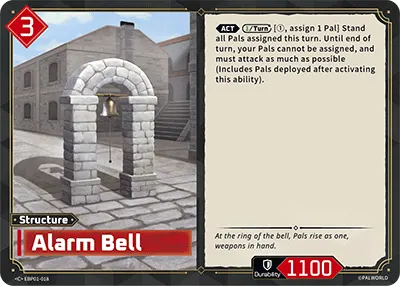
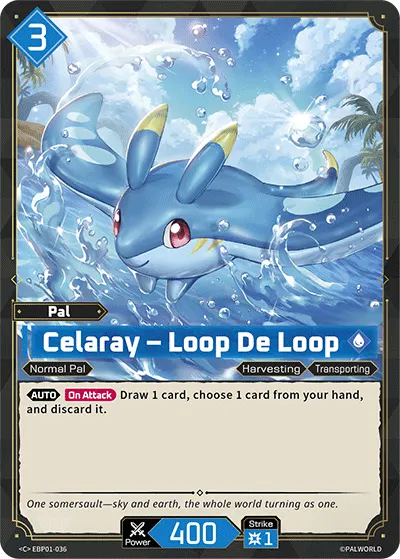
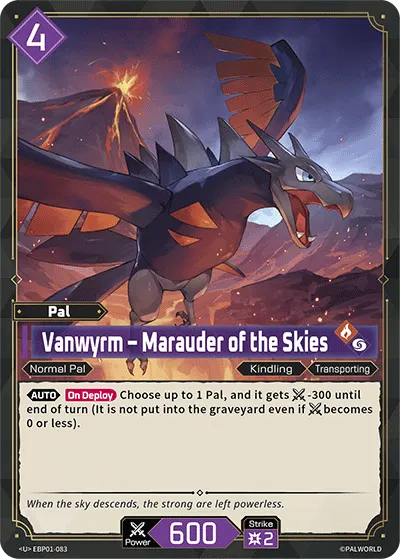
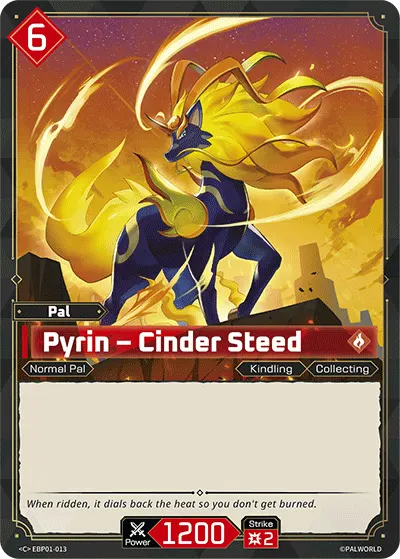
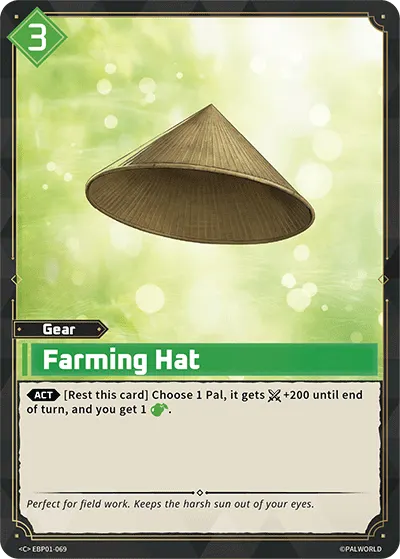
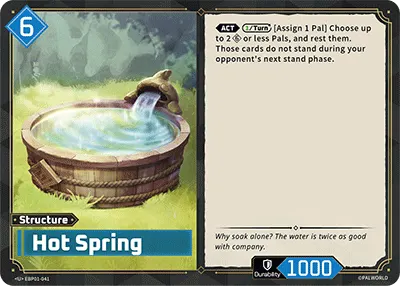
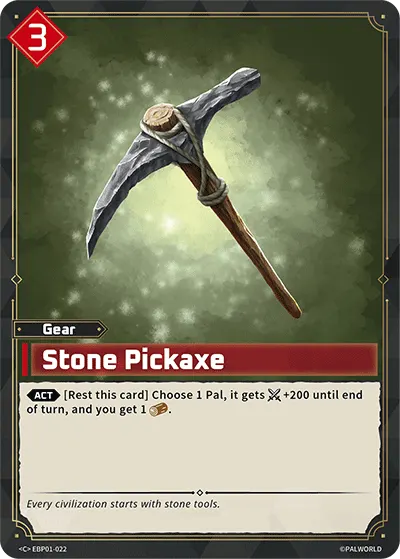
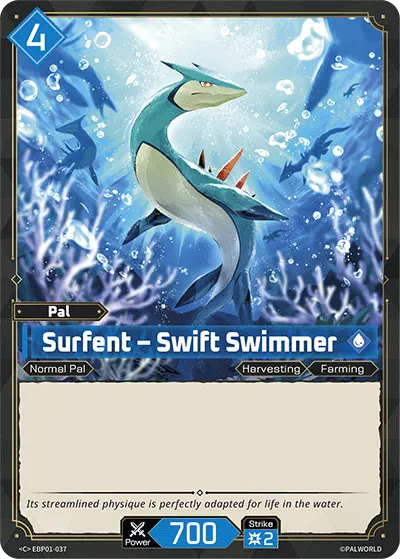
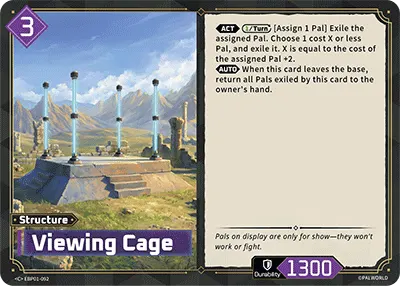
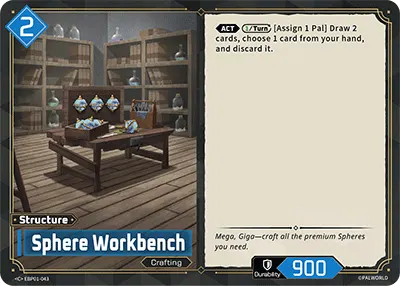
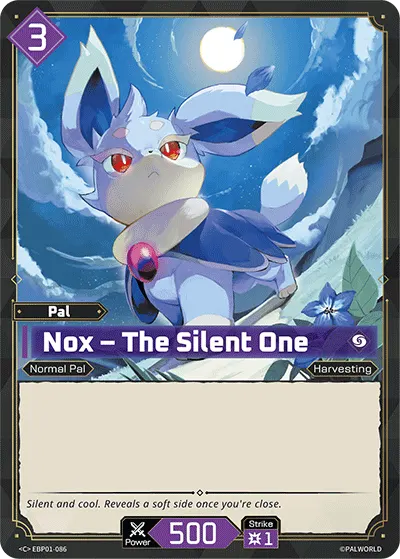
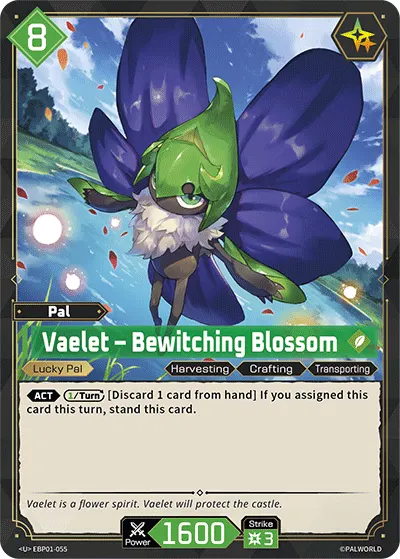
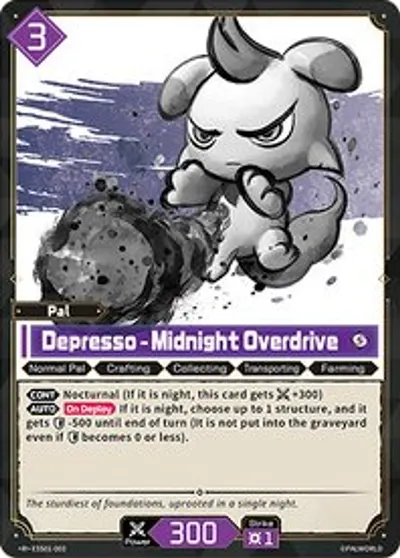
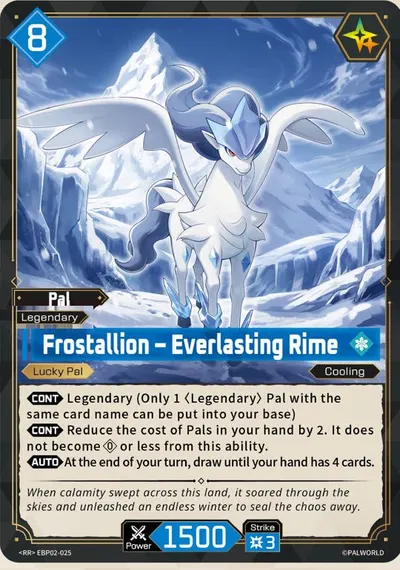
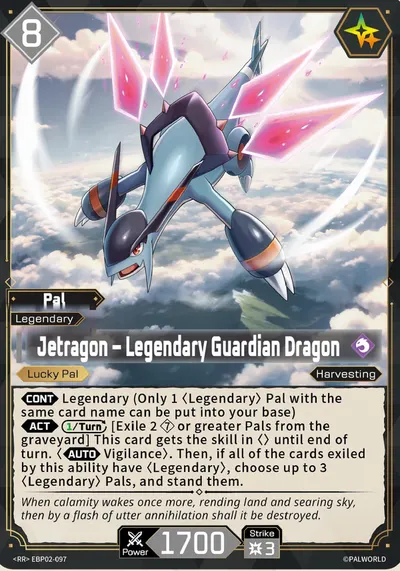
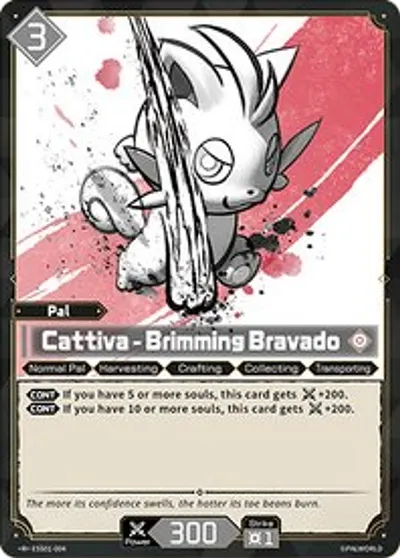
Sleepers
Win when drawn · rarely playedOverplayed
Popular · hurts when drawnHot this week
Biggest play-rate gainsWhat winning decks look like
Win rate by deck composition
Every deck that took a seat in this window, grouped by six numbers read straight off its list. The same six the deck builder shows you while you build. Both seats of every game are counted, so this is the whole field and not only the players who won.
Read this first
These are decks that happen to share a trait, not the effect of the trait. Average cost, average power and average strike mostly move together. An expensive deck is usually a big one, so those three panels are largely one finding shown three times, not three separate discoveries.
And the bottom band of a metric is often just where the untuned lists land: a deck with almost no interrupts is usually also a deck nobody has finished building. Nothing here says that adding four interrupts to your list will win you games. That would be a change to one deck, and this page has only ever measured many different ones.
Interrupts
Cards whose ability interrupts, counted once per copy, 8 means eight of the fifty cards, not eight different cards.
- 0-333.1%
30.9% to 35.4% · 1,707 seats
- 4-742.6%
41.5% to 43.7% · 7,654 seats
- 8-1153.4%
52.7% to 54.2% · 17,950 seats
- 12+52.5%
51.4% to 53.5% · 9,550 seats
Structures
Structure cards, counted once per copy.
- 059.1%
58.1% to 60.1% · 9,873 seats
- 1-449.8%
48.7% to 50.8% · 8,607 seats
- 5-845.4%
44.5% to 46.3% · 11,170 seats
- 9+44.9%
43.8% to 46.1% · 7,211 seats
Draw
Cards whose ability draws, counted once per copy. Not cards drawn per game.
- 0-345.3%
44.1% to 46.5% · 6,797 seats
- 4-748.6%
47.7% to 49.4% · 13,677 seats
- 8-1155.8%
54.9% to 56.7% · 10,928 seats
- 12+47.8%
46.5% to 49.2% · 5,459 seats
Avg cost
Average soul cost across every non-Soul card in the deck.
- <4.042.6%
41.3% to 44.0% · 5,392 seats
- 4.0-4.449.2%
48.3% to 50.1% · 12,479 seats
- 4.5-4.951.2%
50.4% to 52.1% · 13,395 seats
- 5.0+56.0%
54.7% to 57.3% · 5,595 seats
Avg power
Average Power across the Pals only.
- <65049.5%
48.4% to 50.6% · 7,939 seats
- 650-79947.4%
46.6% to 48.2% · 15,076 seats
- 800-89951.1%
50.0% to 52.2% · 8,263 seats
- 900+55.9%
54.6% to 57.2% · 5,583 seats
Avg strike
Average Strike across the Pals only.
- <1.948.1%
47.0% to 49.3% · 7,223 seats
- 1.9-2.047.8%
47.0% to 48.7% · 12,370 seats
- 2.1-2.251.3%
50.4% to 52.2% · 10,857 seats
- 2.3+54.1%
52.9% to 55.3% · 6,411 seats
Counts are always shown. A win rate needs at least 30 seats behind it.